
Every year we face a dizzying array of things we *could* make. We can’t do all of them because of money, time, small production capacity, and me standing in the fabric suppliers going “what have I told you about polka dots?!”.
(I can’t be doing with small polka dots).
We sample a selection of things we think are likely to work, and then we take them to trade shows and see what retailers and the press think. Then we choose what to make the most of, because we can’t make lots of everything. Pretty much every year, both we and the retailers turn out to be a bit rubbish at predicting what you will like most. and as far as we can tell the press like things that don’t sell much at all! Plus, this year, between snow and economic panicking, we didn’t see that many people at the shows anyway.


So, time for a new approach! Ideally I’d love to test your actual buying behaviour, because what people say they would do and what they actually do are often quite different, but to do that we’d have to advance sell products and you all know that that can go terribly wobbly!
We’ve added the products to facebook and pinterest for feedback, but that can be a little dull, so we had a game for you too! Based on the otherwise appalling hot-or-not rating sites, you get to see all the products presented two at a time, and each time you pick the one you prefer or, because we are nice, we have let you also have a no preference button.


Keep going until you want a cup of tea, really! We use your choices to form a list ranking products from most popular to least – I asked for an explanation of how and got this:
”If you imagine each of the pictures as islands with bridges linking them, each time you prefer one picture to another, you raise the preferred island (picture) relative to the less-preferred one.
If your pictures form what’s called a total order – i.e. A > B > C > D etc, then you have what you want.
If they form a non-total order – i.e. people prefer A to B, B to C, but C to A – then, assuming it’s statistically significant, you can still make use of it (based on e.g. how much people preferred one to the other).
You can also cohort the data so you can identify e.g. people who *really* love pink and control for their influence on the pink things.”
Yes, people-who-love-pink, we know about you. We know you’re up to something!

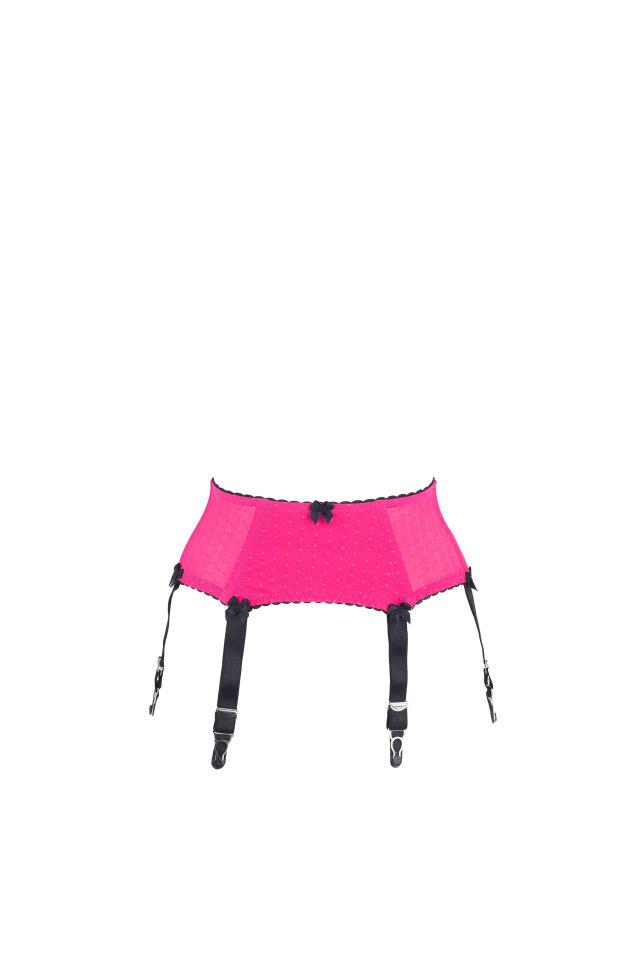
If you really love pink then you should ask your favourite retailer to order it – if we have orders from shops, then we will make them.
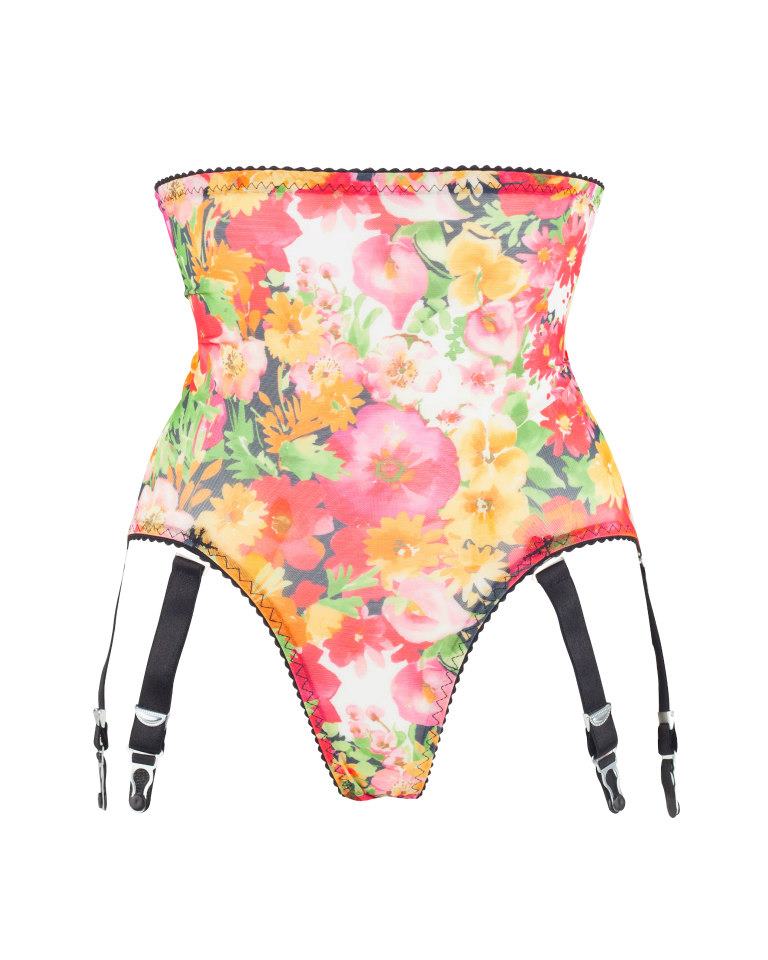

For those of you who recognised that print on the left – well done, you were completely right, it was from a set by Freya. The company that owns them cleared their “remnants” of fabric out last season to our supplier, and while a remnant for a company that makes tens of thousands of a style is basically a waste of time for them, it can translate into hundreds of girdles for us, which is nice! This practice helps to keep our prices for our made in the UK goods down, as printed powernet would otherwise cost us about 3-4 times as much, and of course upcycling this way is far better for the environment than dumping fabric or shipping it out of the country to clear it.
Last but not least – feel free to predict what you think the final ranking will be! For those of you interested in statistics and the-science-of-pants, I promise to post the results AND the ranking of what sold best at the end of the year so you can see the break between predicted and real life behaviour, plus I’ll explain confounding variables that affect the data.
Err... back to pretty pictures now! This one is coming whether you like it or not, because just like everyone needs a robe that goes whoosh, everyone needs tap pants that make you go swish.